
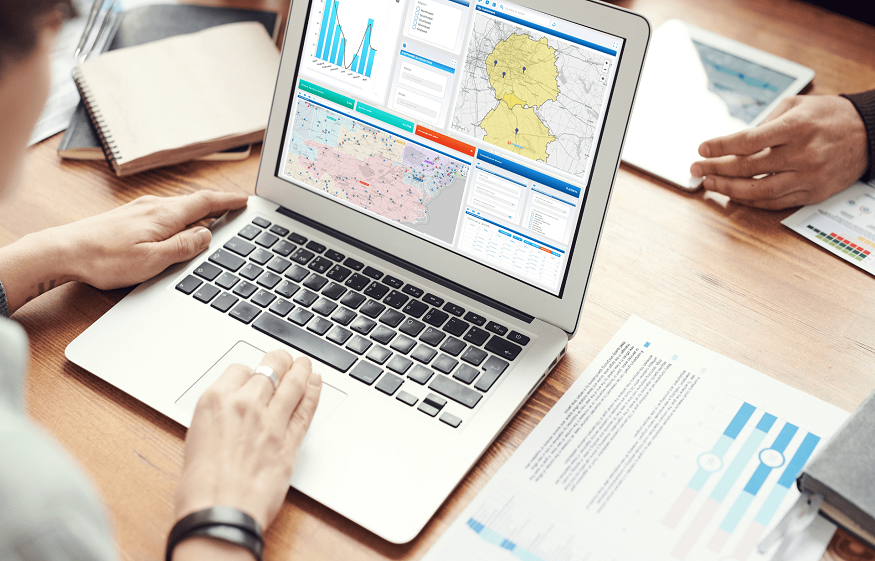
Choosing where to put a building, a warehouse or a portfolio of assets used to rely on a fairly short list of inputs: land price, labour availability, transport links and tax treatment. Those still matter, but they no longer describe the whole risk picture. A site that looks efficient on a spreadsheet can sit in a floodplain that will be uninsurable in fifteen years, or in a district whose water supply is already under strain. Location intelligence software exists to put those spatial realities into the same analysis as the financial ones.
What the Category Actually Covers
At its simplest, this software joins data to places. It takes information that is only meaningful in a geographic context elevation, rainfall patterns, population density, road networks, grid capacity, hazard exposure and makes it queryable alongside a company’s own asset list. The output is not a map for its own sake. It is a set of comparable metrics attached to specific coordinates, so a decision maker can rank fifty candidate sites on consistent criteria rather than arguing from anecdote about which city feels safer or better connected.
Why Traditional Site Analysis Falls Short
Most site selection processes were designed around a stable environment. They assume the hazard profile of a location today will resemble its profile over the asset’s life, and they treat historical loss records as a reliable guide. Neither assumption holds particularly well now. Flood maps built on twentieth-century rainfall understate current exposure in many regions. Heat thresholds that were once exceeded a handful of days a year are exceeded for weeks. An analysis that relies only on what has already happened will systematically under-price the risk of what is coming.
Bringing Forward-Looking Data Into the Model
The more useful platforms add projections rather than just history. That means modelled exposure to flooding, heat stress, drought, wildfire and coastal inundation under different scenarios and time horizons, expressed at the level of an individual parcel rather than a whole region. Equally important is the other side of the equation: how much capacity a location has to adapt. Two sites facing identical physical hazards can end up in very different positions depending on local infrastructure investment, governance and fiscal capacity. Assessments of climate resilience at parcel level make that distinction visible instead of leaving it to judgement.
Turning Spatial Risk Into Financial Terms
Risk scores on their own rarely change a decision. What moves an investment committee is a number in the same units as the rest of the model expected annual loss, downtime days, insurance premium trajectory, or an adjustment to net present value. Good platforms translate hazard exposure into those terms, so a site with a lower purchase price but higher long-run operating and insurance costs can be compared honestly against a more expensive alternative. That translation is where spatial analysis stops being a specialist exercise and starts influencing capital allocation.
Read More: Important Advantages Of Hiring Skilled Plumbers Rather Than Doing It Yourself
Practical Applications Across Sectors
The use cases are broader than they first appear. Real estate investors screen acquisition pipelines and stress-test existing holdings. Industrial operators assess whether a plant’s water supply and power reliability will hold through the asset’s depreciation schedule. Logistics companies model route and hub exposure. Data centre developers weigh cooling demand, grid stability and water availability together, since those constraints interact. Public sector planners use the same tooling to prioritise adaptation spending across districts. In each case the value comes from comparing many locations on one consistent basis.
What to Look for in a Platform
Not all offerings are equivalent, and the differences matter. Ask about spatial resolution, since regional averages hide enormous variation within a single city. Ask which hazard models sit underneath and whether the methodology is documented and reviewable. Check whether outputs are financial or purely categorical, because a colour-coded score cannot be underwritten. Confirm how the data is refreshed, how easily it integrates with existing systems through an API, and whether the vendor can explain a result rather than pointing at a black box. Transparency is the feature that determines whether analysts trust the output enough to act on it.
Common Implementation Mistakes
Two failures recur. The first is treating the tool as a screening filter applied once at acquisition and never revisited, when exposure and adaptation capacity both change over time. The second is running the analysis in isolation from the teams who make decisions an assessment that lands in a sustainability report but never reaches the investment committee changes nothing. The organisations that get value from this tooling build it into an existing workflow at a defined decision point, with an owner and a threshold for escalation.
Read More: When Infosys Rises and Power Grid Falls: Decoding Sectoral Momentum Shifts
Where This Is Heading
Disclosure requirements, lender due diligence and insurer appetite are all moving in the same direction, and each of them asks for location-specific evidence rather than general commitments. Firms that already hold parcel-level analysis for their portfolios are answering those questions from existing work rather than commissioning studies under deadline. Working through practical examples in published climate risk research is a straightforward way to see how other organisations have structured that analysis before committing to an approach of your own.
Site decisions are long-duration commitments made with imperfect information. Spatial analytics will not remove the uncertainty, but it does replace assumption with measurement which is usually the difference between a defensible decision and a lucky one.